
TL;DR: Thumbnail Optimization Tips
Thumbnails drive engagement, with well-designed images increasing click-through rates by up to 90% and views by 154%.
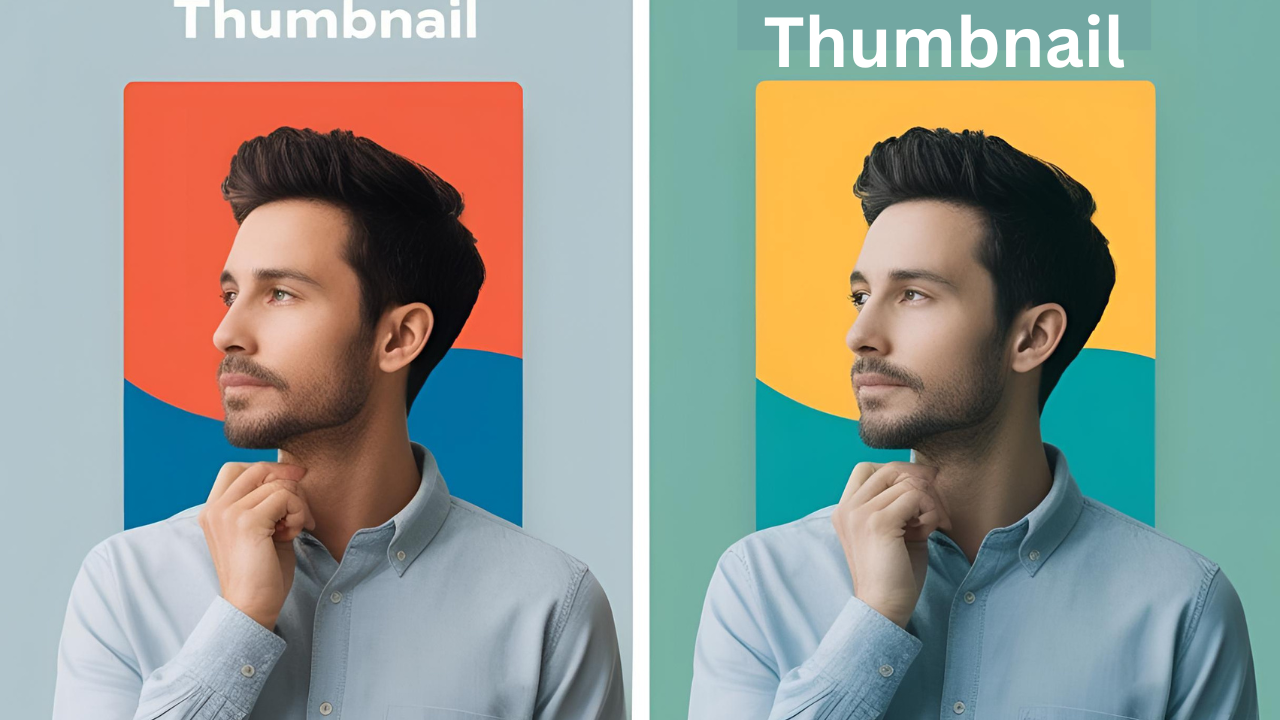
Visual storytelling is essential, using high-contrast colors, emotional triggers, and clear composition to communicate your message instantly.
Technical specifications matter, with 1280x720 pixels (16:9 ratio) being optimal and file size under 2MB for best performance across devices.
Psychological principles boost clicks, including strategic use of faces, color psychology, and creating visual tension or curiosity gaps.
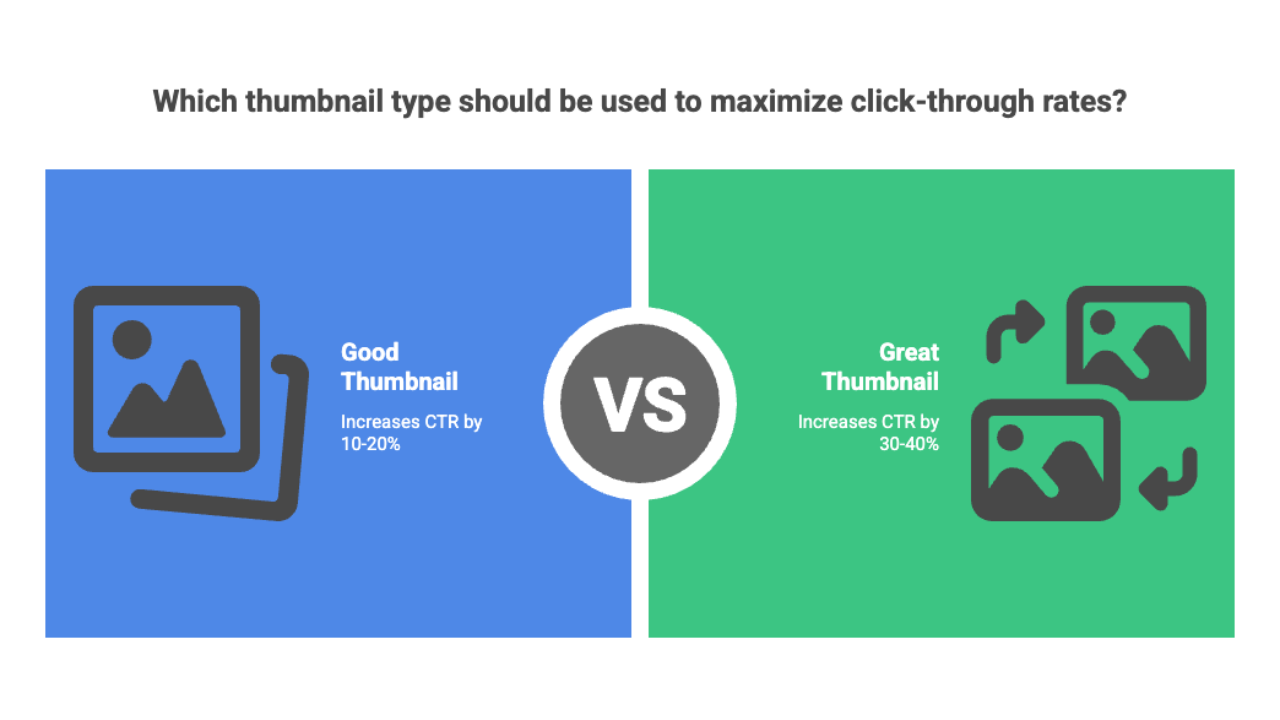
Continuous testing is crucial, as thumbnail effectiveness varies by niche, audience, and platform updates—requiring regular A/B testing and analytics review.
In the competitive world of digital content, your YouTube thumbnail is more than just a picture—it's your video's first impression, your digital storefront, and your most powerful viewer magnet. Crafting the perfect thumbnail can mean the difference between scrolling past and clicking play. If you're looking for a step-by-step approach to creating thumbnails, check out our perfect thumbnail design guide.
Why Thumbnails Matter More Than You Think
Visual communication is instantaneous. Within milliseconds, potential viewers decide whether your content is worth their time based solely on your thumbnail. Consider these critical insights:
- Thumbnails drive up to 90% of video click-through rates
- A compelling design can increase views by 154%
- Professional thumbnails signal content quality and credibility
Key Elements of High-Performance Thumbnails
1. Visual Storytelling in Miniature
Your thumbnail should:
- Capture the video's core message
- Evoke emotion or curiosity
- Use high-contrast, vibrant colors
- Feature clear, legible text
2. Technical Optimization Strategies
Image Quality Essentials
- Recommended resolution: 1280x720 pixels
- File size: Under 2MB
- Supported formats: JPG, PNG, GIF
- Aspect ratio: 16:9
3. Psychological Design Principles
Effective thumbnails leverage fundamental visual psychology:
- Use faces to create immediate emotional connection
- Implement bold, readable text overlays
- Create visual tension or intrigue
- Maintain consistent branding elements
Advanced Thumbnail Creation Techniques
Color Psychology
| Color | Emotion | Best Used For |
|---|---|---|
| Red | Excitement, urgency | Action, gaming, breaking news |
| Blue | Trust, professionalism | Educational, business content |
| Yellow | Optimism, attention-grabbing | Tutorials, positive content |
| Green | Growth, positivity | Fitness, finance, nature |
Emotional Triggers
- Surprise elements
- Implied movement or action
- Personal transformation narratives
- Problem-solution frameworks
A/B Testing Your Thumbnails
Continuously experiment with different thumbnail designs. What works today might evolve tomorrow.
"The difference between a good and great thumbnail can be a 30-40% increase in click-through rate." - MrBeast
- Create two versions of your thumbnail with one variable changed
- Run both versions for equal time periods
- Compare CTR and watch time metrics
- Implement the winning design and repeat the process
Tools and Resources
Free Tools
- Canva - Templates and easy editing
- GIMP - Free Photoshop alternative
- YT-Thumbnail - Study successful competitors
For a comprehensive list of free tools and detailed tutorials, check out our free YouTube thumbnail tools guide.
Paid Options
- Adobe Photoshop - Professional editing capabilities
- TubeBuddy - Thumbnail A/B testing
- VidIQ - Thumbnail analytics
Common Mistakes to Avoid
Check out our detailed breakdown of YouTube thumbnail pitfalls to ensure your designs stand out for the right reasons.
Mobile Optimization
Over 70% of YouTube views come from mobile devices. To optimize for mobile:
- Make text larger than you think necessary
- Test thumbnails at small sizes before publishing
- Focus on a single, clear focal point
- Ensure high contrast between elements
Performance-Driven Case Studies
Theory is valuable, but nothing demonstrates the power of thumbnail optimization like real-world results. Let's examine three channels that transformed their performance through strategic thumbnail improvements.
Educational Channel Case Study: 187% CTR Improvement
TechEd Academy, a mid-sized educational channel with 85,000 subscribers, was struggling with low click-through rates despite high-quality content. Their initial metrics showed:
- Average CTR: 2.4%
- Average views per video: 4,200
- Subscriber conversion rate: 0.8%
Thumbnail Problems Identified:
- Text-heavy designs with small, difficult-to-read fonts
- Low contrast between text and background
- Inconsistent branding across videos
- Lack of emotional triggers or curiosity elements
Optimization Changes Implemented:
- Reduced text to 3-4 words maximum with 250% larger font size
- Implemented high-contrast yellow/black color scheme for text
- Added instructor's face showing relevant emotion for each topic
- Created a consistent template with brand colors and positioning
Results After 90 Days:
- New average CTR: 6.9% (187% improvement)
- New average views: 11,300 (169% increase)
- New subscriber conversion: 1.7% (112% improvement)
Most Impactful Changes: Analysis revealed that the addition of the instructor's face showing relevant emotions (surprise for "unknown facts" videos, concentration for tutorials) had the greatest impact on CTR, while the consistent branding template most improved subscriber conversion rates.
Gaming Channel Case Study: 245% View Increase
GamersUnite, a gaming channel with 124,000 subscribers focusing on strategy games and walkthroughs, was experiencing declining viewership despite consistent upload schedule.
Starting Metrics:
- Average CTR: 3.1%
- Average views per video: 7,800
- Average watch time: 6:42 minutes
Thumbnail Problems Identified:
- Generic game screenshots without customization
- Lack of visual hierarchy or focal points
- Minimal text with poor readability against game backgrounds
- No visual differentiation between video types
Optimization Changes Implemented:
- Created custom thumbnail templates for different content types (reviews, walkthroughs, tips)
- Implemented bright color overlays to increase contrast
- Added reaction faces for emotional connection
- Used large, bold typography with drop shadows for readability
- Incorporated progress indicators for walkthrough series (e.g., "PART 3: BOSS BATTLE")
Results After 60 Days:
- New average CTR: 8.7% (180% improvement)
- New average views: 26,900 (245% increase)
- New average watch time: 8:21 minutes (24% increase)
Most Impactful Changes: The addition of reaction faces showing excitement or surprise generated the highest CTR improvements, while the content-type templates helped viewers quickly identify the videos most relevant to their interests.
Review Channel Case Study: 78% Higher Subscriber Conversion
TechReviewer, a product review channel with 230,000 subscribers, was struggling with subscriber growth despite steady viewership.
Starting Metrics:
- Average CTR: 4.2%
- Subscriber conversion per 1000 views: 5.3
- Average comment engagement: 87 comments per video
Thumbnail Problems Identified:
- Product images too small or lacking detail
- Inconsistent thumbnail style across product categories
- Unclear value proposition in thumbnails
- Lack of visual rating indicators
Optimization Changes Implemented:
- Created a visual rating system using color-coded elements (green for recommended, red for avoid)
- Implemented close-up product shots highlighting key features
- Added subtle price indicators in corner ($, $$, $$$)
- Used consistent "WORTH IT?" or "AVOID!" text treatments
- Incorporated before/after elements for transformation-based products
Results After 120 Days:
- New average CTR: 5.8% (38% improvement)
- New subscriber conversion per 1000 views: 9.4 (78% increase)
- New average comment engagement: 142 comments per video (63% increase)
Most Impactful Changes: The visual rating system had the most significant impact on subscriber conversion, as viewers appreciated the immediate value judgment. The "WORTH IT?" question format drove the highest comment engagement as it encouraged viewers to share their own opinions.
Scientific A/B Testing Framework
Random thumbnail testing isn't enough—you need a systematic approach to generate reliable, actionable data. Here's how to implement a scientific framework for your thumbnail experiments.
Setting Up Controlled Thumbnail Experiments
Establishing Testing Hypotheses:
Start with a clear, testable hypothesis for each experiment:
- "Adding a human face will increase CTR by at least 20%"
- "Red text overlays will outperform blue text overlays"
- "Question-based titles will generate higher engagement than statement titles"
Your hypothesis should be specific, measurable, and focused on a single variable whenever possible.
Variable Isolation Methodology:
To ensure valid results, isolate the variable you're testing:
- Create a control thumbnail (your current best performer)
- Create a variation that changes ONLY the element you're testing
- Keep all other elements identical (background, composition, other text)
- Document all specifications of both versions for future reference
Sample Size Determination:
Your test needs sufficient data to be statistically valid:
- Channels under 10,000 subscribers: Minimum 1,000 impressions
- Channels with 10,000-100,000 subscribers: Minimum 5,000 impressions
- Channels over 100,000 subscribers: Minimum 10,000 impressions
For extremely small channels, consider running tests for longer periods or on your highest-traffic content types.
Test Duration Guidelines by Channel Size:
- Micro channels (under 5,000 subscribers): 14-21 days
- Small channels (5,000-50,000 subscribers): 7-14 days
- Medium channels (50,000-250,000 subscribers): 3-7 days
- Large channels (250,000+ subscribers): 1-3 days
End tests early only if you observe extreme performance differences (over 100% improvement or decline).
Multivariate Testing Techniques
Testing Multiple Variables Simultaneously:
Once you've mastered single-variable testing, multivariate testing allows you to examine interaction effects between elements:
- Identify 2-3 key variables to test (e.g., text color, face vs. no face, background style)
- Create thumbnails representing all possible combinations
- Implement rotation testing across similar content pieces
- Track performance metrics for each combination
Factorial Design Approach:
Use a structured factorial design to organize your tests:
- 2×2 design: Tests two variables with two variations each (4 thumbnails)
- 2×2×2 design: Tests three variables with two variations each (8 thumbnails)
- 3×2 design: Tests one variable with three variations and one with two variations (6 thumbnails)
Example 2×2 design:
- Thumbnail A: Red text + face
- Thumbnail B: Red text + no face
- Thumbnail C: White text + face
- Thumbnail D: White text + no face
Analyzing Interaction Effects:
Some elements perform differently in combination than they do alone:
- Text color might perform differently depending on background image
- Facial expressions might have different impacts based on text messaging
- Color schemes might interact with seasonal themes
Document these interaction effects to develop nuanced thumbnail strategies.
Tools for Multivariate Analysis:
- TubeBuddy's A/B testing feature (supports rotation testing)
- VidIQ's thumbnail analyzer
- Google Analytics for advanced user segment analysis
- Custom tracking spreadsheets (templates available online)
Data Collection and Analysis Methods
Key Metrics to Track (Beyond CTR):
While CTR is important, comprehensive analysis includes:
- Impression-to-view conversion rate
- Average view duration for each thumbnail variant
- Audience retention differences
- Subscriber conversion rate
- Click source (browse features vs. search results vs. suggested videos)
- Device-specific performance (mobile vs. desktop)
Setting Up Tracking Systems:
- Create a standardized testing log with consistent fields
- Document all variables and specifications
- Record both raw numbers and percentage changes
- Note external factors that might influence results (holidays, trending topics)
- Include screenshots of all tested thumbnails
Statistical Significance Calculation:
Determine if your results represent actual patterns or random chance:
- For basic testing, aim for at least a 20% difference in performance
- For more rigorous analysis, use chi-square tests or z-score calculations
- Most A/B testing tools will calculate significance automatically
- Generally, p < 0.05 (95% confidence) is considered statistically significant
Interpretation Guidelines and Common Pitfalls:
- Beware of the novelty effect: Sometimes new designs perform better simply because they're different
- Consider audience segments: Results might vary across subscriber vs. non-subscriber views
- Watch for seasonal influences: Holiday-themed thumbnails might skew results
- Don't overreact to outliers: Extremely high or low performance might be anomalous
Implementing Test Results at Scale
Pattern Recognition Across Test Results:
After conducting multiple tests, look for recurring patterns:
- Do certain colors consistently outperform others across different content?
- Do specific emotional expressions generate higher CTR regardless of topic?
- Are there composition elements that consistently improve performance?
Create a "pattern library" documenting these consistent findings.
Creating Data-Driven Thumbnail Templates:
Based on your test results, develop templated approaches for different content types:
- Identify your top-performing thumbnail elements
- Create modular templates that incorporate these elements
- Develop content-specific variations (tutorials vs. reviews vs. entertainment)
- Build a style guide documenting your proven formulas
Continuous Testing Methodology:
Implement an ongoing testing calendar:
- Dedicate 10-20% of your videos to testing new concepts
- Retest previously successful elements quarterly
- Schedule comprehensive template reviews every 6 months
- Test seasonal variations before relevant periods
Balancing Innovation with Proven Patterns:
Avoid the optimization trap of becoming too formulaic:
- Maintain 70% proven elements and 30% experimental elements
- Schedule "innovation sprints" to test radically different approaches
- Monitor competitor and industry trends for new ideas to test
- Consider audience feedback when developing new test concepts
Seasonal Thumbnail Optimization
Seasonal trends significantly impact viewer behavior and preferences. Strategic thumbnail adjustments can help you capitalize on these predictable patterns.
Annual Content Calendar for Thumbnail Planning
Major Holidays and Events by Quarter:
Q1 (January-March):
- New Year's resolutions themes (fitness, productivity, finance)
- Valentine's Day (relationships, gifts, experiences)
- Spring preparation (cleaning, organization, outdoor activities)
- Tax season (finance, organization, stress management)
Q2 (April-June):
- Easter/Spring break (family activities, travel, recipes)
- Mother's Day (gifts, appreciation, family)
- Graduation season (achievement, next steps, celebration)
- Summer preparation (fitness, travel planning, outdoor activities)
Q3 (July-September):
- Summer vacation (travel, activities, family fun)
- Back-to-school (education, organization, productivity)
- Labor Day (final summer activities, transitions)
- Fall preparation (home, fashion, seasonal changes)
Q4 (October-December):
- Halloween (costumes, decorations, entertainment)
- Thanksgiving (food, family, gratitude)
- Black Friday/Cyber Monday (shopping, deals, reviews)
- Christmas/Hanukkah/Holiday season (gifts, decoration, celebration)
- New Year's Eve (reflection, celebration, planning)
Seasonal Color Psychology Changes:
Adjust your color schemes to match seasonal expectations:
- Spring: Fresh greens, pastel colors, bright yellows
- Summer: Vibrant blues, sunny yellows, tropical color palettes
- Fall: Warm oranges, deep reds, earthy browns
- Winter: Cool blues, festive reds and greens, silver and gold accents
- Holiday-specific: Traditional color schemes (Halloween orange/black, Christmas red/green)
Planning Timeline for Thumbnail Updates:
- 60 days before: Research seasonal trends and competitor approaches
- 30 days before: Design seasonal thumbnail templates and test concepts
- 14 days before: Implement seasonal elements on upcoming content
- During season: Monitor performance and make adjustments
- 7 days after: Evaluate performance and document learnings
Evergreen vs. Seasonal Content Considerations:
- Evergreen content: Use subtle seasonal elements that won't date the content
- Seasonal content: Embrace bold seasonal themes for timely relevance
- Hybrid approach: Create alternate thumbnails for evergreen content during peak seasons
- Update strategy: Consider refreshing old content with seasonal thumbnails during relevant periods
Holiday-Specific Thumbnail Strategies
Christmas/Winter Holiday Thumbnail Elements:
- Color palette: Red, green, gold, white, and blue
- Visual elements: Snow effects, gift boxes, festive lights, cozy settings
- Typography: Festive fonts for holiday-specific content
- Emotional triggers: Joy, nostalgia, togetherness, excitement
- Composition: Warm indoor settings contrasted with cool outdoor elements
Summer-Themed Thumbnail Optimization:
- Color palette: Bright blues, sunny yellows, tropical greens
- Visual elements: Water, sunshine, outdoor activities, vacation imagery
- Typography: Casual, fun fonts with bright colors
- Emotional triggers: Freedom, adventure, relaxation, energy
- Composition: Open spaces, outdoor settings, high-key lighting
Back-to-School Thumbnail Approaches:
- Color palette: Primary colors, school colors (red, blue, yellow)
- Visual elements: School supplies, books, technology, learning environments
- Typography: Clean, educational fonts with good readability
- Emotional triggers: Achievement, organization, fresh starts, confidence
- Composition: Structured layouts with clear information hierarchy
Balancing Seasonal Elements with Brand Consistency:
- Maintain consistent placement of brand elements
- Use seasonal colors that complement your brand palette
- Create seasonal variations of your logo or channel icon
- Develop a seasonal style guide to ensure consistency
- Limit seasonal elements to 30-40% of the thumbnail composition
Cultural Events and Trending Topics
Major Sporting Events:
Olympics:
- Incorporate national colors for relevant countries
- Use action shots related to featured sports
- Include medal elements for performance-related content
- Time content to coincide with popular events
World Cup/Super Bowl:
- Use team colors for targeted audience segments
- Create urgency with time-specific elements ("Pre-Game," "Final Predictions")
- Incorporate ball/equipment imagery as graphic elements
- Consider split-test thumbnails for different team fan bases
Award Shows and Entertainment Events:
- Oscars/Grammys: Use gold/silver elements and formal imagery
- TV season premieres: Incorporate show colors and iconic elements
- Movie releases: Create thumbnails that complement (without copying) official marketing
- Fashion events: Use trending colors and style elements
How to Tastefully Incorporate Trending Topics:
- Research trending hashtags and search terms
- Use subtle visual references rather than text-heavy explanations
- Connect trends to your content's value proposition
- Create thumbnail variants for different audience segments
- Avoid controversial aspects of trending topics
Avoiding Dated or Irrelevant References:
- Set calendar reminders to update or retire seasonal thumbnails
- Create "fallback" thumbnails for when seasonal content is out of season
- Focus on emotional themes rather than specific dated references
- Test thumbnails with small audience segments before full implementation
- Monitor engagement metrics for signs of thumbnail fatigue
Measuring Seasonal Thumbnail Performance
Setting Seasonal Performance Benchmarks:
- Establish baseline metrics from previous years' seasonal performance
- Create season-specific KPIs based on historical patterns
- Adjust expectations based on seasonal viewer behavior (e.g., lower summer engagement)
- Set different benchmarks for different content categories
- Consider external factors (platform changes, market conditions)
Year-over-Year Comparison Methodologies:
- Compare same-season performance across years
- Normalize data for channel growth and subscriber changes
- Analyze performance ratios rather than absolute numbers
- Create seasonal performance dashboards
- Document platform changes that might impact year-over-year comparisons
Identifying Which Seasonal Elements Drive Performance:
- Conduct element-specific A/B tests during seasonal periods
- Track performance of specific seasonal signifiers
- Survey audience about seasonal thumbnail preferences
- Analyze click patterns on different seasonal elements
- Compare performance across different audience segments
Creating a Seasonal Thumbnail Optimization Database:
- Document all seasonal thumbnails with performance metrics
- Tag thumbnails with specific elements and approaches
- Record audience feedback and qualitative observations
- Note platform trends during each seasonal period
- Create a searchable library of seasonal approaches
Conclusion: Your Thumbnail, Your Brand
Mastering YouTube thumbnails is an ongoing journey of creativity, psychology, and strategic design. Each thumbnail is an opportunity to tell a story, spark curiosity, and invite viewers into your content world.
Optimizing your YouTube thumbnails isn't just about making them look good—it's about strategic design that drives clicks and views. By implementing the techniques in this guide, you can create thumbnails that stand out in a crowded feed and compel viewers to click.
Remember that thumbnail optimization is an ongoing process. Continue testing, analyzing results, and refining your approach based on what works for your specific audience.
Ready to transform your YouTube presence? Start optimizing your thumbnails today!
For more YouTube thumbnail resources, check out these guides:
- YouTube Thumbnail Basics - Perfect for beginners
- Design the Perfect YouTube Thumbnail - Step-by-step guide
- Create Eye-Catching YouTube Thumbnails - Advanced techniques
- Common Thumbnail Mistakes to Avoid - Prevent these errors
- Free Tools for YouTube Thumbnails - No-cost solutions
Happy optimizing!